Post Content
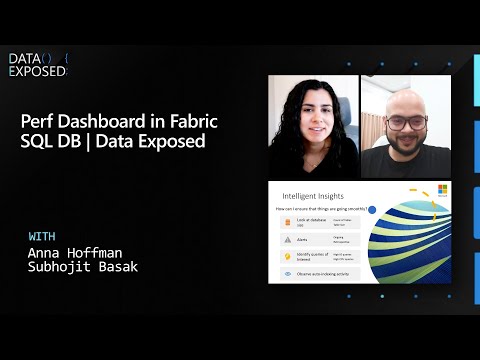
Join Subhojit Basak, Product Manager in Azure Data, and Anna Hoffman on Data Exposed, a Microsoft Developer YouTube series, as they explore the Performance Dashboard in Microsoft Fabric SQL Database.
In this episode, we dive into how the Performance Dashboard provides robust diagnostic tools and real-time metrics to help identify and resolve performance bottlenecks in your SQL database. Learn how database administrators and developers can leverage this built-in monitoring solution to analyze query performance, detect slowdowns, and optimize workloads for a seamless database experience.
✅ Chapters:
0:00 Introduction
2:33 Alerts
3:06 Demo
4:00 Developer-friendly tuning
5:20 Performance Dashboard
6:30 Demo
9:22 Other tabs in performance dashboard
11:40 Getting started
✅ Resources:
Blog: https://blog.fabric.microsoft.com/en-us/blog/my-fabric-sql-database-is-running-slow/
Microsoft Learn: https://learn.microsoft.com/en-us/fabric/database/sql/performance-dashboard
Fabric Community Forum: https://community.fabric.microsoft.com/
Reddit: https://www.reddit.com/r/MicrosoftFabric
📌 Let’s connect:
Twitter – Anna Hoffman, https://twitter.com/AnalyticAnna
Twitter – AzureSQL, https://aka.ms/azuresqltw
🔴 Watch even more Data Exposed episodes: https://aka.ms/dataexposedyt
🔔 Subscribe to our channels for even more SQL tips:
Microsoft Azure SQL: https://aka.ms/msazuresqlyt
Microsoft SQL Server: https://aka.ms/mssqlserveryt
Microsoft Developer: https://aka.ms/microsoftdeveloperyt
#AzureSQL #SQL #LearnSQL Read More Microsoft Developer